

In this article
Do you know how beneficial Linear Regression Analysis is for various sectors working in the IT Industry? If not, then you really need to know about it. Usually, it can help users to acquire useful data about consumers for specific products for future decisions.
Moreover, we will introduce you to a reputed training institute offering a dedicated training program related to AI skills. What are we waiting for? Let’s get straight to the topic!
What is Linear Regression Analysis?
By fitting a linear equation to observed data, linear regression is a statistical method for modeling the connection between a dependent variable and one or more independent variables. Through the identification of a "line of best fit," this approach enables you to estimate future results based on known inputs and measure the strength of a relationship.
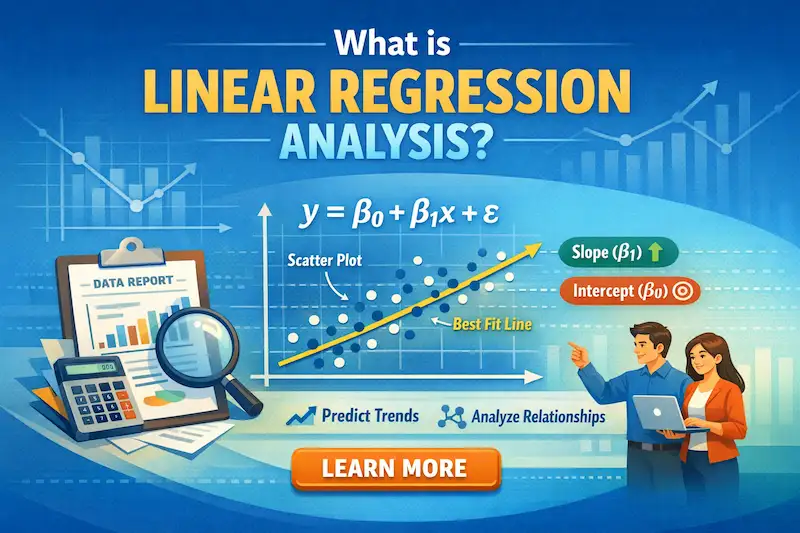
It is frequently used in industries including marketing, healthcare, and finance to turn unprocessed data into projections and trends that may be put to use. Let’s take a look at what Linear Regression Analysis is and its benefits!
Key Concepts of Linear Regression
The following are the key concepts of linear regression:
- Variables: Dependent vs. Independent: The dependent variable (Y) is the result or "target" that you are attempting to forecast, whereas the independent variable (X) is the input or "predictor" that you control.
- The Line of Best Fit (Ordinary Least Squares): The distinct line that minimizes the total squared vertical distances (residuals) between each data point and the line itself is determined using this method.
- Key Model Parameters: The intercept (β0), which is the value of Y when X is zero, and the slope (β1), which shows the change in Y for each unit increase in X, define the model.
- Critical Assumptions (The "LINE" Rule): The data must demonstrate linearity, independence of errors, residual normality, and equal variance (homoscedasticity) for the results to be considered genuine.
- Evaluation Metrics: R-squared (the amount of variance the model explains) and RMSE (Root Mean Square Error), which indicates the average difference between the actual data and the projected line, are often used metrics to assess accuracy.
Step-by-Step Guide to Performing Linear Regression
|
S.No. |
Steps |
What? |
|
1. |
Data Collection and Exploration |
Determine your dependent variable (Y) and independent variable (X). To visually verify a linear trend, create a scatterplot; linear regression might not be the best method if the data appears to be a curve or a random cloud. |
|
2. |
Data Preprocessing |
By addressing missing values and eliminating notable outliers that can disproportionately pull the "line of best fit" away from the rest of the data, you can clean up your dataset. Think about scaling your variables if they have distinct scales (e.g., age vs. annual income). |
|
3. |
Model Training (Fitting the Line) |
To get the line that minimizes the squared vertical distances between the data points and the line, apply the Ordinary Least Squares (OLS) approach. The Intercept (β0) and Slope (β1) of your model are created in this stage. |
|
4. |
Assumptions and Adequacy Checking |
Verify the "LINE" rules to validate the model. The residual plot is the most important check; the mistakes should be dispersed at random around zero. A "U" or a funnel shape indicates that your model is biased and needs to be adjusted. |
|
5. |
Evaluation and Prediction |
Assess the model’s strength using R-squared (how much variance is explained) and RMSE (average prediction error). Once satisfied, predict future results by entering fresh X values into your equation (Y = β0 + β1X). |
Why is Linear Regression Important in AI?
Linear Regression is important in AI for the following reasons:
● Foundation of Neural Networks: In a neural network, a single neuron executes a weighted sum of inputs plus a bias, which is basically a linear regression equation's functional form.
● High Interpretability (Explainable AI): Through precisely stated coefficients, it enables developers to understand how much each input variable influences the final prediction, making the model "glass-box" as opposed to "black-box."
● Efficiency and Speed: Compared to deep learning models, it takes substantially less processing power and training time because it depends on closed-form mathematical solutions or straightforward gradient descent.
● Baseline for Comparison: It acts as a starting point for figuring out the "floor" of performance; if a sophisticated AI model is unable to outperform a straightforward linear regression, then the complexity is probably superfluous.
● Identifying Feature Importance: Engineers can rapidly determine which data points are noise and which are the best predictors by examining the amount of the learnt weights.
The Difference Between Simple and Multiple Linear Regression
|
S.No. |
Factors |
Topics |
What? |
|
1. |
Independent Variables |
Simple Linear Regression |
Predicts the result using a single independent variable (X). |
|
Multiple Linear Regression |
predicts the result using two or more independent factors (x1, x2,..., xn). |
||
|
2. |
Visual Representation |
Simple Linear Regression |
Shown graphically on a 2D plane as a straight line. |
|
Multiple Linear Regression |
Graphically depicted as a "hyperplane" or multidimensional plane that is difficult to sketch in two dimensions. |
||
|
3. |
Mathematical Form |
Simple Linear Regression |
complies with the fundamental formula y = β0 + β1x + ε. |
|
Multiple Linear Regression |
y = β0 + β1x1 + β2x2 +... + βnxn + ε is the enlarged equation. |
||
|
4. |
Complexity |
Simple Linear Regression |
Because it simply evaluates the direct impact of one component, it is much easier to compute and analyze. |
|
Multiple Linear Regression |
It is more complicated because it has to take multicollinearity, the potential for independent variables to influence one another, into consideration. |
||
|
5. |
Use Case Example |
Simple Linear Regression |
Estimating someone's weight based only on their height. |
|
Multiple Linear Regression |
Estimating a person's weight using their height, age, daily caloric intake, and amount of exercise. |
Assumptions in Linear Regression Analysis
The following are some assumptions in Linear Regression Analysis:
a) Linearity: A straight line, which indicates that the change in output is proportionate to the change in input, must exist between the independent and dependent variables.
b) Independence of Observations (Autocorrelation): To ensure that the residual (error) of one observation does not affect or predict the residual of the next, the data points must be gathered independently of one another.
c) Homoscedasticity (Constant Variance): Instead of fanning out or narrowing, the "spread" or variance of the residuals should stay constant across all levels of the independent variables.
d) Normality of Residuals: The errors (residuals) should have a normal bell-curve distribution with a zero center for each given predictor value.
e) No or Little Multicollinearity: The independent variables in multiple regression shouldn't have a strong correlation with one another because this makes it challenging to identify each predictor's unique influence.
Common Pitfalls in Linear Regression
|
S.No. |
Factors |
What? |
|
1. |
Sensitivity to Outliers |
A single extreme data point can "pull" the entire line toward it, significantly altering the slope and intercept because Linear Regression seeks to minimize the squared errors. |
|
2. |
Overfitting with Too Many Variables |
Your R2 value may be artificially inflated by adding unrelated predictors, which would make the model appear flawless on training data but perform appallingly on fresh, untested data. |
|
3. |
Confusing Correlation with Causation |
A strong association between X and Y, such as ice cream sales and shark attacks, does not always indicate that X causes Y; frequently, the real driver is a third "lurking" variable, such as summer heat. |
|
4. |
Extrapolation Errors |
It is risky to use the model to forecast values that are significantly outside of the original training data range since the linear relationship could not hold true in such extreme areas. |
|
5. |
Multicollinearity Noise |
Unstable coefficients result from the model's inability to identify which of two highly correlated independent variables (such as "years of education" and "age") is truly responsible for the change in the output. |
|
6. |
Ignoring Non-Linear Patterns |
Fitting a straight line to naturally curved data, such as exponential growth, will result in systematic mistakes and low predictive power. |
|
7. |
The "Dummy Variable Trap" |
When all categories of a qualitative variable (such as male and female) are included in multiple regression along with an intercept, perfect multicollinearity is created, rendering the model mathematically unsolvable. |
How to Avoid Common Pitfalls in Linear Regression?
You can avoid common pitfalls in Linear Regression in the following way:
- Handle Outliers Early: To identify extreme values and either eliminate them or employ "Robust Regression" approaches that are less susceptible to spikes, use statistical techniques such as Z-scores or IQR.
- Use Regularization (Lasso/Ridge): To keep the model from getting too complicated and to aid in automatic feature selection, use Lasso (L1) or Ridge (L2) regression to penalize big coefficients.
- Check for Multicollinearity with VIF: To make sure independent variables aren't duplicated, compute the Variance Inflation Factor (VIF) for each predictor and eliminate variables with high scores (often >5 or 10).
- Transform Non-Linear Data: When the relationship between variables is curved rather than linear, use mathematical transformations like log, square root, or polynomial features.
- Address Heteroscedasticity: To guarantee that the "spread" of errors is consistent across all forecasts, use Weighted Least Squares or modify the dependent variable (target).
- Validate with a "Hold-out" Set: To make sure the model does a good job of generalizing to new data rather than merely memorizing the training noise, always divide your data into training and testing sets (or use Cross-Validation).
- Avoid Extrapolation: Limit your model's predictions within the range of values found in your training set to prevent erroneous, wild estimates in "unknown territory."
Interpreting the Results of a Linear Regression Model
|
S.No. |
Factors |
What? |
|
1. |
Coefficients (β values) |
For each unit increase in an independent variable, they show how the dependent variable changes. A negative coefficient denotes an inverse relationship, whereas a positive coefficient shows that an increase in X causes an increase in Y. |
|
2. |
Intercept (β0) |
When all independent variables are zero, the regression line crosses the vertical axis at this "baseline" value of Y. |
|
3. |
R-Squared (R2) |
This indicates the proportion of the target variable's volatility that your model can account for. An R2 of 0.85 indicates that 85% of the data's behavior can be explained by your model, with error or missing components accounting for the remaining 25%. |
|
4. |
P-Values |
These test the "null hypothesis." A relationship is deemed statistically significant if the p-value is less than 0.05; if it is greater, the variable may simply be influencing the outcome by coincidence. |
|
5. |
Adjusted R-Squared |
This version is a more honest metric for Multiple Linear Regression than conventional R2 since it penalizes you for adding "junk" variables that don't enhance the model. |
|
6. |
Residual Plots |
You can determine whether your model is biased by examining a plot of the errors (actual-predicted). A pattern, such as a "U" shape, indicates that a non-linear link is absent from your model. |
|
7. |
Standard Error |
This calculates the mean separation between the observed values and the regression line. The accuracy of the model's predictions is shown by a lower standard error. |
|
8. |
F-Statistic |
This indicates whether the whole model outperforms a model without predictor variables. A low p-value and a high F-statistic show that at least one of your predictors has a meaningful relationship with the result. |
Tools and Software for Linear Regression Analysis
The following are some tools and software for linear regression analysis:
● Programming Languages (Data Science & AI): With libraries like Scikit-Learn and Statsmodels, Python is the industry standard, although R is still a popular option due to its powerful lm() function and statistical visualization features.
● Spreadsheet Software (Quick & Accessible): For non-programmers, Microsoft Excel and Google Sheets are ideal since they provide instantaneous analysis via the "Data Analysis ToolPak" or built-in functions like =LINEST().
● Statistical Software (Research & Academia): Because of their "point-and-click" academic reporting and deep hypothesis testing, specialized software like SPSS, Stata, and JASP is favored in the social sciences and medical fields.
● Business Intelligence (BI) & Visualization Tools: Users can incorporate linear trendlines straight into interactive executive dashboards with platforms like Tableau and Power BI (using DAX's LINESTX).
● Mathematical Platforms (Engineering & Physics): For engineers who need to include regression into intricate physical simulations or matrix-intensive computations, MATLAB and Wolfram Mathematica are the preferred options.
Applications of Linear Regression in Real-World Scenarios
|
S.No. |
Examples |
What? |
|
1. |
Predictive Analytics in Real Estate & Finance |
It is used by analysts to forecast stock price trends based on past market indications or to estimate property prices by correlating square footage and location. |
|
2. |
Healthcare and Medical Research |
Researchers use it to determine how lifestyle factors like BMI affect blood pressure levels or to simulate the relationship between medication dosage and patient recovery time. |
|
3. |
Sales Forecasting and Business Marketing |
By projecting how much money will be made for each dollar spent on various advertising channels, marketing teams utilize it to compute the "Return on Ad Spend" (ROAS). |
Conclusion
Now that we have talked about the Linear Regression Analysis, you might want to learn how it works professionally for the users. For that, you can get in contact with Craw Security, offering the Six-Months Diploma in Artificial Intelligence (AI) and Machine Learning to IT Aspirants.
During the training sessions, students will be able to test their knowledge on various tasks while using linear regression analysis skills under the guidance of experts. Moreover, online sessions will facilitate students in remote learning.
After the completion of the Artificial Intelligence (AI) and Machine Learning Six-Months Diploma offered by Craw Security, students will receive a certificate validating their honed knowledge & skills during the sessions. What are you waiting for? Contact, Now!
Frequently Asked Questions
About Linear Regression Analysis
- What is the linear regression analysis?
By fitting a linear equation to observed data to forecast future results, linear regression analysis is a statistical technique used to characterize and quantify the relationship between a dependent variable and one or more independent variables.
- What is the difference between correlation and regression?
Regression employs the relationship between two variables to generate a prediction equation that forecasts the value of one variable based on the other, whereas correlation evaluates the degree and direction of that link.
- How to explain linear regression results?
Using the P-value to determine statistical significance and R-squared to gauge the model's overall predictive power, one may explain linear regression results by analyzing the Direction and Magnitude of the coefficients to comprehend how changes in inputs impact the output.
- What is the basic principle of linear regression?
Finding the distinct straight line that most accurately depicts the trend in the data is the fundamental idea behind linear regression, which models the connection between a dependent variable (Y) and one or more independent variables (X).
- What are the three types of regression?
The following are the 3 types of regression:
a) Linear Regression (The Straight Line),
b) Logistic Regression (The S-Curve), and
c) Polynomial Regression (The Curved Line).
- What are the 7 steps in regression analysis?
The following are the 7 steps in regression analysis:
a) Define the Problem & Objective,
b) Collect and Prepare the Data,
c) Perform Exploratory Data Analysis (EDA),
d) Formulate & Train the Model,
e) Test the Assumptions,
f) Evaluate Model Performance, and
g) Deployment & Prediction:
- What are the 5 rules of linear regression?
The following are the 5 rules of linear regression:
a) Linearity,
b) Homoscedasticity (Equal Variance),
c) Independence of Observations,
d) Normality of Residuals, and
e) No Multicollinearity (for Multiple Regression).
- What is the best method of regression?
There isn't a single "best" approach because it all depends on your data. For example, Random Forest Regression is frequently the best for raw prediction accuracy, Logistic Regression for binary classification, and Linear Regression for maximum interpretability.
Want to build a career in cyber security?
Talk to our counsellors about courses, batches and fees. Free demo class available.


